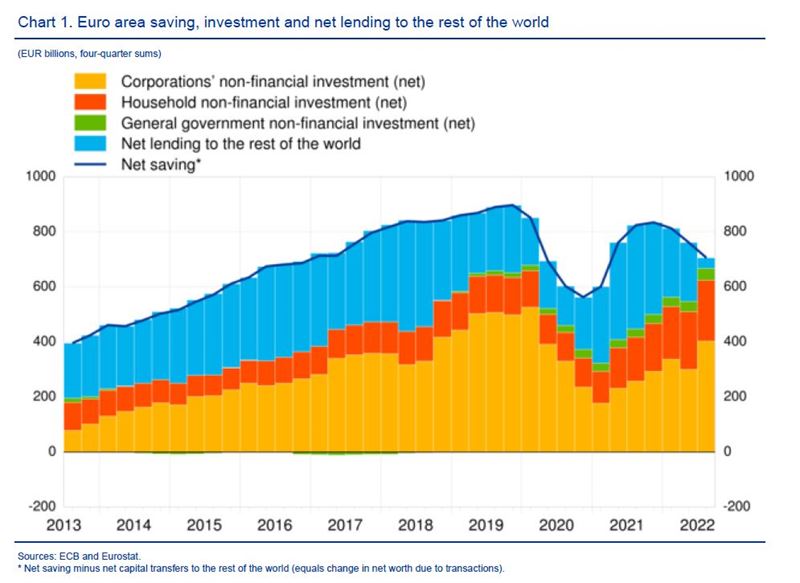
- Euro area net saving decreased to €678 billion in four quarters up to third quarter of 2022, compared with €731 billion one quarter earlier
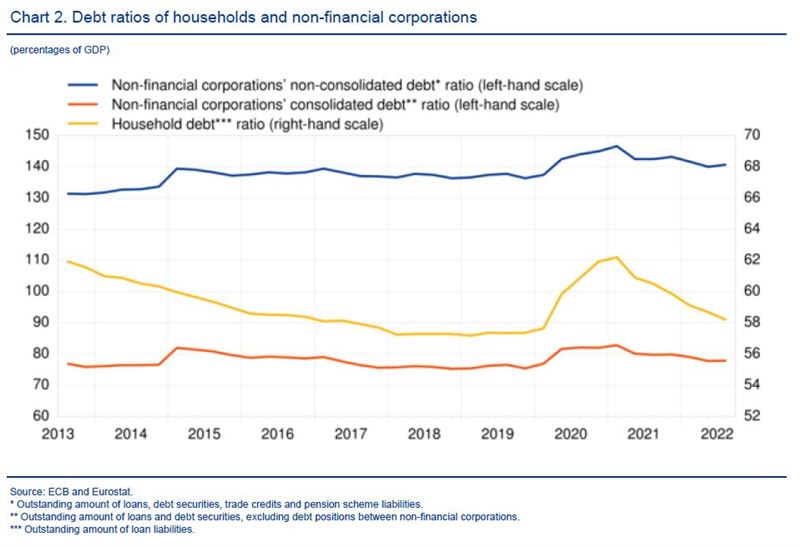
- Household debt-to-income ratio declined to 94.7% in third quarter of 2022 from 96.0% one year earlier
- Non-financial corporations’ debt-to-GDP ratio (consolidated measure) decreased to 77.6% in third quarter of 2022 from 79.4% one year earlier
Total euro area economy
Euro area net saving decreased to €678 billion (6.5% of euro area net disposable income) in the four quarters to the third quarter of 2022, as compared with €731 billion one quarter earlier. Euro area net non-financial investment increased to €667 billion (6.4% of net disposable income), as investment by all four main sectors of the economy, namely households, general government, and non-financial and financial corporations, increased (see Chart 1).
Euro area net lending to the rest of the world decreased to €39 billion (from €214 billion in the previous quarter), as net saving decreased and non-financial investment increased. Net lending by households decreased to €318 billion (3.1% of net disposable income, after 3.6%). Net lending of non-financial corporations declined to €3 billion (0.0% of net disposable income, after 1.4%) while that of financial corporations was broadly unchanged at €68 billion (0.7% of net disposable income). The decrease in net lending by the total private sector was partially offset by a decline in net borrowing by the general government sector (-3.4% of net disposable income, after -3.6%).

Data for euro area saving, investment and net lending to the rest of the world (Chart 1)
Households
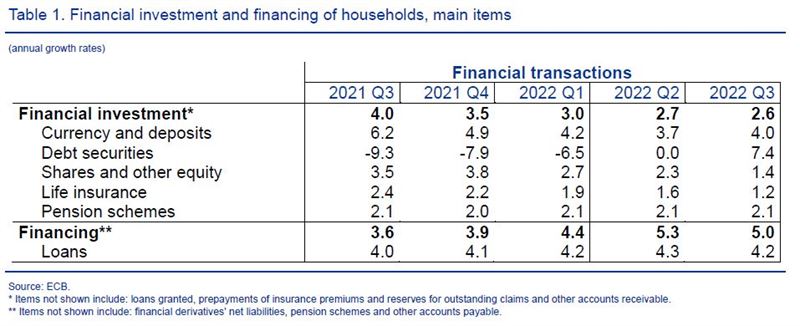
Household financial investment increased at a broadly unchanged annual rate of 2.6% in the third quarter of 2022. This was due to higher growth rates of investment in currency and deposits (4.0%, after 3.7%) and debt securities (7.4%, after 0.0%), which were offset by a deceleration of investment in shares and other equity (1.4%, after 2.3%) and in life insurance (1.2%, after 1.6%) (see Table 1 below).
Households were overall net buyers of listed shares. By issuing sector, they were net buyers primarily of listed shares issued by non-financial corporations and the rest of the world (i.e. shares issued by non-euro area residents), and to a lesser extent of listed shares of MFIs, other financial institutions and insurance corporations. Households made net purchases of debt securities issued by general government and to a lesser extent non-financial corporations and MFIs, while selling debt securities issued by other financial institutions and the rest of the world (see Table 2.2. in the Annex).
The household debt-to-income ratio[1] decreased to 94.7% in the third quarter of 2022 from 96.0% in the third quarter of 2021. The household debt-to-GDP ratio declined to 58.2% in the third quarter of 2022 from 60.5% in the third quarter of 2021 (see Chart 2).

Data for financial investment and financing of households (Table 1)
[1]Calculated as loans divided by gross disposable income adjusted for the change in pension entitlements.

Data for debt ratios of households and non-financial corporations (Chart 2)
Non-financial corporations
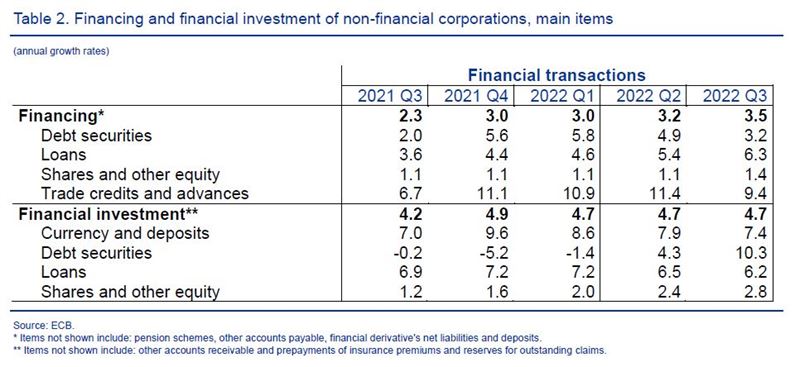
In the third quarter of 2022, the annual growth of financing of non-financial corporations increased to 3.5% from 3.2% in the previous quarter, reflecting an acceleration in financing by loans as well as shares and other equity, while the financing by trade credits and debt securities decelerated (see Table 2 below).
The acceleration of loan financing was due to higher growth rates in loans from MFIs, from within the non-financial corporations sector, from general government and from the rest of the world, while loans from other financial institutions decelerated (see Table 3.2 in the Annex).
Non-financial corporations’ debt-to-GDP ratio (consolidated measure) decreased to 77.6% in the third quarter of 2022 from 79.4% in the third quarter of 2021; the non-consolidated, wider debt measure, decreased to 140.7% from 142.5% (see Chart 2).

Data for financing and financial investment of non-financial corporations (Table 2)
ecb.europa.eu


