- Euro area net saving decreased to €626 billion in 2022, compared with €668 billion in the four quarter period ending on the third quarter of 2022
- Household debt-to-income ratio declined to 93.1% in fourth quarter of 2022 from 95.8% one year earlier
- Non-financial corporations’ debt-to-GDP ratio (consolidated measure) decreased to 74.7% in fourth quarter of 2022 from 79.0% one year earlier
Total euro area economy[1]
Euro area net saving decreased to €626 billion (5.9% of euro area net disposable income) in 2022 compared with €668 billion in the four quarter period ending on the third quarter of 2022. Euro area net non-financial investment was broadly unchanged at €661 billion (6.3% of net disposable income), reflecting stable net investment by all euro area sectors (see Chart 1).
Euro area net lending to the rest of the world decreased to €2 billion (from €39 billion previously), reflecting the lower net saving and the broadly unchanged net non-financial investment. Net lending of non-financial corporations increased to €75 billion (0.7% of euro area net disposable income) from €57 billion, while that of financial corporations grew to €76 billion (0.7% of euro area net disposable income) from €61 billion. Net lending by households decreased to €335 billion (3.2% of euro area net disposable income) from €347 billion. The increase in net lending by the total private sector was more than offset by an increase in net borrowing by the general government to €484 billion (-4.6% of euro area net disposable income), after €426 billion previously.
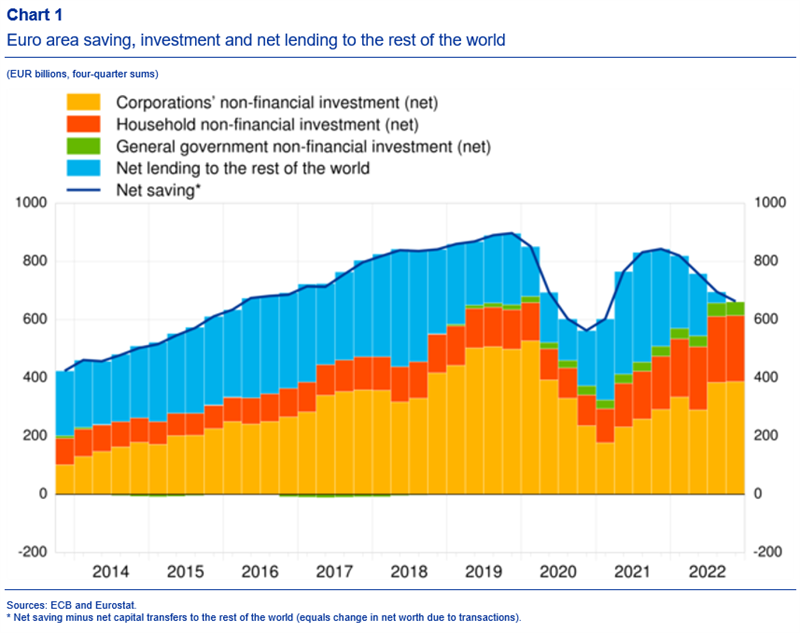
Data for euro area saving, investment and net lending to the rest of the world (Chart 1)
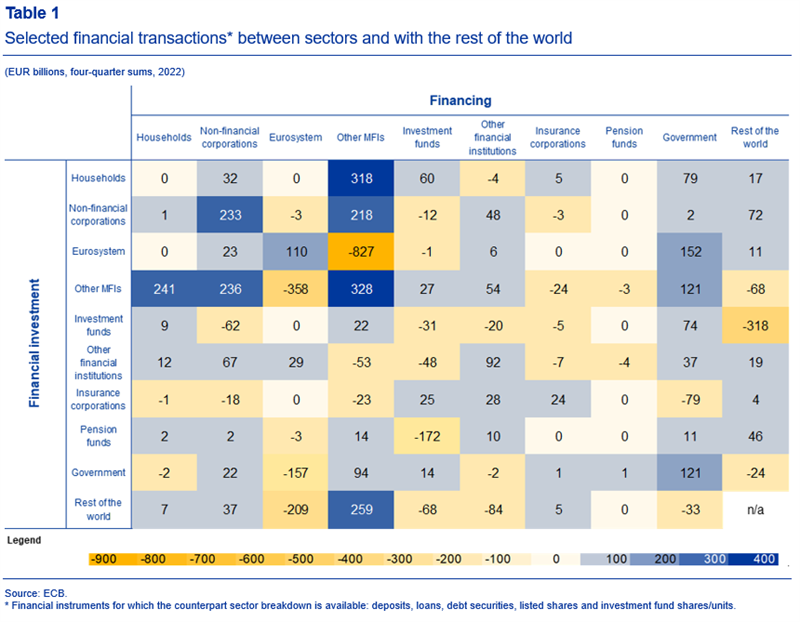
Financial transactions can be presented with a counterpart sector breakdown for deposits, loans, debt securities, listed shares and investment fund shares (see Table 1). In 2022 the largest aggregated transactions in these financial instruments were interbank operations as other MFIs[2] redeemed liabilities with the Eurosystem (-€827 billion), decreased deposits with the Eurosystem (-€358 billion) and increased deposits and other assets with other MFIs (€328). Financial investment of households involved to a large extent transactions vis-à-vis other MFIs (€318 billion), mostly in the form of deposits, as well as the financing of government through purchases of debt securities (€79 billion). In parallel, the financing received by households from other MFIs in the form of loans amounted to €241 billion. The largest financial transactions vis-à-vis the rest of the world involved euro area investment funds, which sold (in net terms) instruments issued by the rest of the world (-€318 billion). In addition, the financing of other MFIs received from the rest of the world reached €259 billion.
Households
Household financial investment increased at an annual rate of 2.5% in the fourth quarter of 2022, down from 2.7% in the previous quarter. Investment in currency and deposits as well as shares and other equity were the main contributors to this deceleration, while net purchases of debt securities accelerated (see Table 2 below).
Households were net buyers of debt securities issued by all sectors except other financial institutions. Households were overall net buyers of listed shares, primarily those issued by non-financial corporations and the rest of the world (i.e. shares issued by non-residents), while selling listed shares issued by MFIs (see Table 2.2. in the Annex).
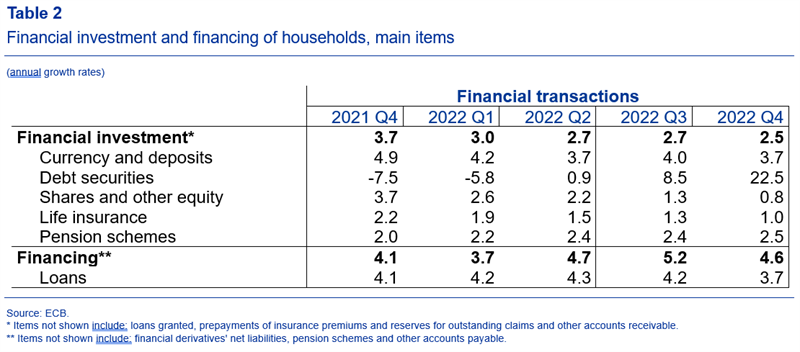
Data for financial investment and financing of households (Table 2)
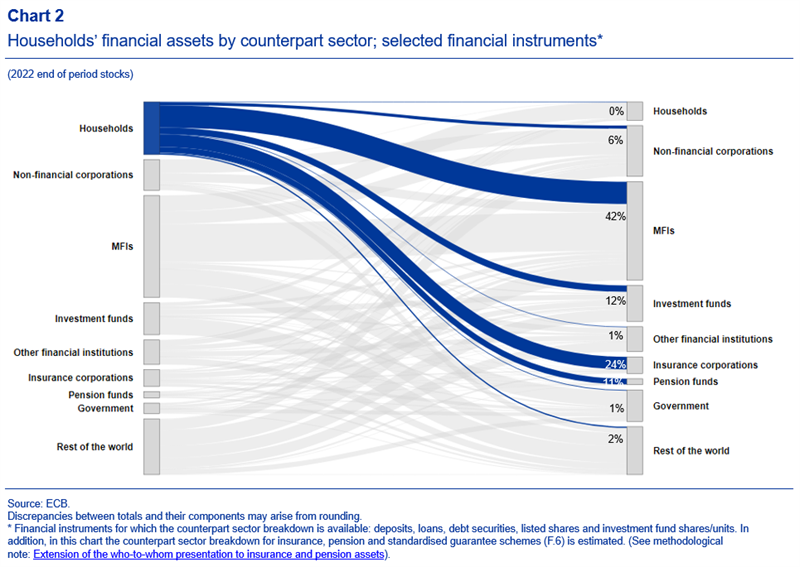
Chart 2 below shows the stock of selected financial assets held by households (in dark blue) vis-à-vis counterpart sectors, at the end of 2022.[3] Households’ financial assets were mostly issued by financial intermediaries such as MFIs (42% of households’ allocated financial assets), insurance corporations (24%), investment funds (12%) and pension funds (11%). Holdings of financial assets vis-à-vis non-financial corporations (6%), government (1%) and the rest of the world (2%), mainly in the form of listed shares and debt securities, represented much lower proportions of households’ financial assets.
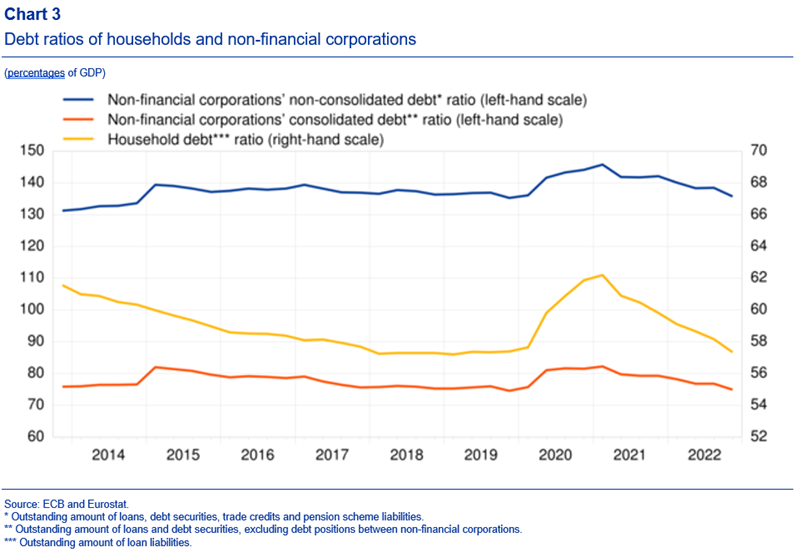
The household debt-to-income ratio[4] decreased, to 93.1% in the fourth quarter of 2022 from 95.8% in the fourth quarter of 2021. The household debt-to-GDP ratio declined, to 57.3% in the fourth quarter of 2022 from 59.8% in the fourth quarter of 2021 (see Chart 3).
Data for debt ratios of households and non-financial corporations (Chart 3)
Non-financial corporations
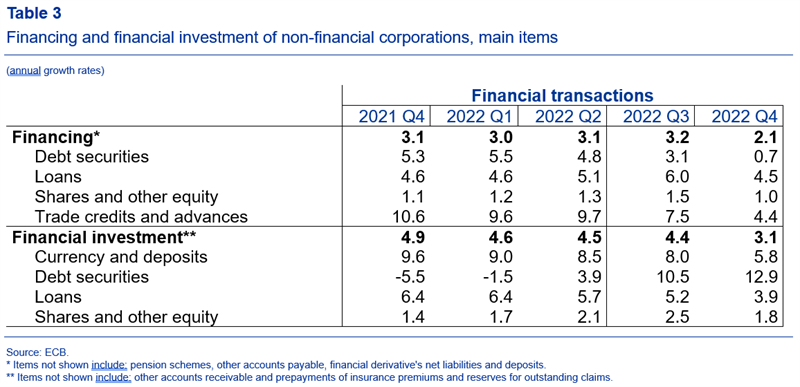
In the fourth quarter of 2022, the annual growth of financing of non-financial corporations declined to 2.1%, after 3.2% in the previous quarter. This resulted from a deceleration in financing by loans, in particular from MFIs, other financial institutions and the rest of the world, as well as financing in the form of debt securities, shares and other equity, and trade credits (see Table 3 below and Table 3.2 in the Annex).
Data for financing and financial investment of non-financial corporations (Table 3)
Non-financial corporations’ debt-to-GDP ratio (consolidated measure) decreased to 74.7% in the fourth quarter of 2022, from 79.0% in the fourth quarter of 2021; the non-consolidated, wider debt measure declined to 135.7% from 142.1% (see Chart 3).
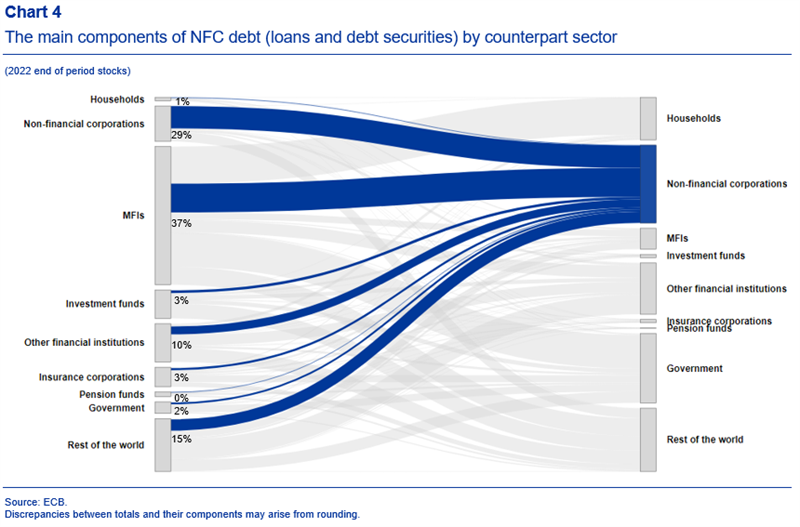
Chart 4 below shows the main components of the non-financial corporations’ debt (in dark blue) vis-à-vis counterpart sectors. At the end of 2022, the non-financial corporations’ debt in the form of loans and debt securities was held primarily by MFIs (37%), other non-financial corporations (29%), the rest of the world (15%) and other financial institutions (10%).
For queries, please use the Statistical information request form.
ecb.europa.eu


